Background and overview[1]
Citalopram oxalate (CIT) is a selective serotonin reuptake inhibitor with good tolerance and few adverse reactions. It is recommended as the drug of choice for long-term treatment of depression. In 1998, the US FDA approved it for sale in the United States and in 1999 it was sold in the Chinese market. CIT is a racemate, and its S-enantiomer selectively inhibits the reabsorption of serotonin, while the R-enantiomer (R)-citalopram oxalate has little effect.
Instruments and reagents[1]
American Agilent Hypersil 1010 HPLC instrument, DVD detector. S-CIT reference substances and samples were provided by Guangzhou Zuosen Biotechnology Co., Ltd. S-CIT reference substance is refined from S-CIT [batch number: 20030108], R-isomer <4.0%, related substances <0.5%, the content is determined by the normalization method, calculated as dry product, and must not contain C20H21FN2O·C2H2O4 Less than 99.5%. Methanol and acetonitrile were of chromatography grade, glacial acetic acid and triethylamine were of analytical grade, and water was deionized water and used after distillation.
Methods and results[1]
1. Chromatographic conditions
Chromatographic column: Use Chirobiotic V chiral column (250mm*4.6mm, 5μm), with methanol-acetic acid-triethylamine (100:0.1:0.1) as the mobile phase; the detection wavelength is 240nm, and the chromatographic column temperature is 20 ℃, the flow rate is 1.0mL·min-1. The separation between S and R isomers is greater than 1.5, and the retention times of R and S isomers are approximately 14.3 min and 15.5 min respectively.
2. Investigation of linear relationship
Accurately weigh an appropriate amount of S-CIT reference substance, dissolve it with mobile phase, and dilute it to make a solution containing 1 mg per 1 mL as a stock solution. Precisely pipette the stock solution into a 10 mL volumetric flask to make a concentration of 10, 25 , 50, 100, 150μg·mL-1 solution. Inject 20 μL of each of the above solutions, and record the peak area of each main component peak. Take the average peak area (A) as the ordinate and the concentration (C, μg·mL-1) as the abscissa. Perform linear regression, and the regression equation is A=49224.78C-55.066 (r=0.9991, n=5). The measurement results show that S-CIT has a good linear relationship between peak area and concentration within the range of 10~150 μg·mL-1, and the separation of S-type and R-type isomers is >1.5.
3. Precision test
Precisely measure the 25, 50, and 100 μg·mL-1 concentrations under the linear range test, repeat the injection 5 times according to the above chromatographic conditions, record the peak area of each component, and calculate The RSD of the peak area of each component, the measurement results show that the RSD of S-CIT is 1.0%<2.0%.
4. Recovery rate investigation
Precisely measure the S-CIT stock solution, add mobile phase and dilute quantitatively into 5 parts each of solutions containing S-CIT 25, 50 and 100 μg·mL-1 per 1 mL, according to the standard Inject 20 mL of sample under the chromatographic conditions under the curve and calculate the recovery rate. The measurement results show that the average recovery rates of S-CIT are 99.32, 99.27%, and 99.87% respectively, and the RSD is in the range of 0.8% to 2.6%.
5. Detection limit
Use mobile phase to prepare 5 μg·mL -1 S-CIT reference solution, with an injection volume of 6 μL, and the detection limit is 0.03 μg (10 times signal-to-noise ratio).
6. Sample measurement
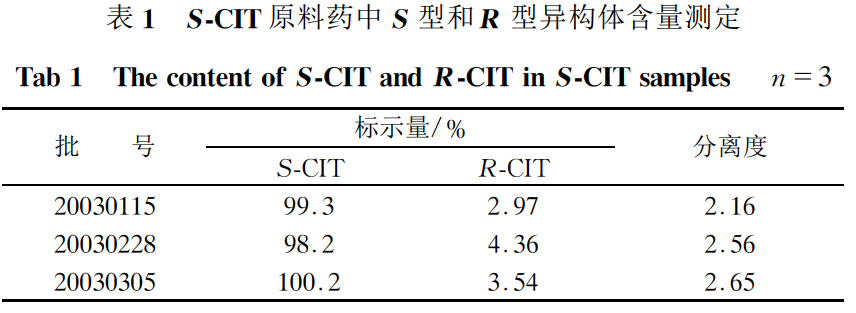
Take about 10 mg of S-CIT, weigh it accurately, add mobile phase to dissolve and quantitatively dilute it to make a solution of 100 μg·mL-1; take 20 μL and inject it into the liquid chromatograph, and record the chromatogram. The ratio of the R-isomer and S-isomer contents in the test sample was calculated according to the normalization method. The results showed that the R-isomers were all below 5%, and the separation degree was greater than 1.5. The results are shown in Table 1.

References
[1] Yang Xuemei, Liu Xu, Yan Yichen, Xu Jiangping. Determination of S-citalopram oxalate content [J]. Chinese Journal of New Drugs, 2004(11):1020-1021.


